Often people who go on to study economics are unaware of the misconceptions that Economics 101 leaves them with. In fact, when discussing the problems with introductory economics a few of the defenders of the curriculum will without fail demonstrate these misconceptions. Having recently encountered a few of these misconceptions in the wild I decided to debunk a couple of them.
Misconception 1: Supply curves can be easily measured
Often when discussing supply curves people act as if supply curves are something that can be easily inferred from real world data on the behaviour of prices and quantities. For example, one poster in a recent debate stated ” A supply curve is just the relationship between the price and the quantity of a good or service. As the price goes up or down, the quantity goes up or down.” A supply curve is not the relationship between the quantity and the price of a good and service, a supply curve is a theoretical curve that when combined with a demand curve gives the relationship between quantity and price for a good or service.
In fact, a supply curve cannot be inferred from the movement of prices and quantities, except in exceptional circumstances. Supply and demand curves jointly determine prices and quantities, so unless additional information is used the two concepts cannot be disentangled. The impossibility of determining supply and demand curves from aggregate data is actually the textbook example of what is known as the identification problem in economics.
A consequence of the above is that you cannot determine from the movement of prices and quantities whether or not a supply curve exists.
Misconception II: Monopolists and companies in Monopolistic Competition have supply curves
As I posted earlier, the supply curve of a firm comes from maximizing the firms profit function. Since profits are given by 


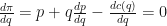

What happens if price does change as demand increases? In that case the firm’s profit maximization condition depends on how price changes, which will depend on demand conditions and the competitive structure of the industry. Since the firms profit maximization depends on demand it isn’t possible to draw a curve representing firms behaviour at a given price that is independent of demand. Supply and demand are not separable. Because of that supply curves are never drawn for firms in anything other than perfect competition.
It can sometimes be meaningful to ask the question of how much a monopolist would want to produce assuming the quantity it sold did not affect the price, ie assuming
Even the above form of a supply curve does not exist if a firm’s marginal costs are not increasing. The second order conditions for maximizing a firm’s profit functions require that 
Probably the greatest damage that introductory economics does to prospective economists is teach that supply and demand is the fundamental tool of analysis in economics. Students learn to spend the majority of their time studying tools that apply only in perfect competition or in cases with no production at all. Worse, very few students even recognize the limitations of the tools they are learning to use. Even economics PHD students are frequently unaware of the limitations of supply curves.
The damage of these misconceptions do cannot be overstated. Many practicing economists’ intuitions about markets come entirely from analysis of the perfectly competitive case, since they use supply and demand as their default mental model. Even though many more complicated models do not assume perfect competition, the tendency to think in terms of supply and demand influences what models are studied, and how economists think. Unfamiliarity with the limitations of supply curves in a microeconomic context also likely contributes to their misuse in the context of macroeconomics, where economists seeking intuitive models often shoehorn macroeconomic issues into the microeconomic framework they are most familiar with by drawing supply and demand curves for various macroeconomic variables.

“the supply curve of a firm comes from maximizing the firms profit function” — is it always defined in terms of the profit function, or would it be possible at least in principle to define it without reference to profit? For example, suppose we were dealing with a collection of simulated firms run by simulated agents with their own internal rules for deciding how many of a given simulated good to manufacture, based on various external inputs including the current market price of the good (assume all the firms are price takers). If we re-ran the simulation many times with all initial variables *except* the market price kept constant, and looked at how many units the firms would choose to manufacture at each possible market price, couldn’t this be used to conceptually define the supply curve, just based on the fact that the curve is on a graph where one axis is the price and the other is the number of units supplied?
Even if so, we obviously can’t measure a real-world supply curve this way in practice, but a similar problem applies to other theoretical tools based on what-ifs, like the “fitness landscape” commonly used in theoretical models in population genetics (which would ideally require cloning many different copies of organisms with each possible genome in the population and placing them in identical environments to see the fraction of each that survive and reproduce). In both cases you might at least be able to find some “natural experiments” that very roughly approximate the ideal measurement, or derive some generic conclusions about what would be expected given some broad classes of fitness landscapes/supply curves.
LikeLike